Platforms We Have Built

Each System Solves One Well-Defined Operational Problem

Below, each platform is set out the same way — the problem it addresses, what we built, how it works, and what it changes for the business.
Geotechnical Drilling Data System

01 The Operational Challenge

Drilling programmes generate a great deal of valuable data and lose much of its value in transit. Field records are captured on paper or loose spreadsheets, samples are tracked informally, and the report a client eventually receives is assembled by hand weeks after the rig has moved on. Errors are found late, chain of custody is difficult to prove, and planning teams end up making decisions on information they cannot fully verify.

02 The Solution We Developed

GeoCorelytics is an integrated management system for geotechnical drilling operations. It brings borehole planning, structured field capture, sample and test tracking, live analytics and automated report generation into a single environment — so data is recorded once, validated at the point of capture, and available to everyone who needs it from that moment on.

03 How The System Works
PlanBoreholes are planned and scheduled, with targets and locations mapped before mobilisation.
CaptureField teams record on purpose-built forms, on device, with validation as they type.
TrackSamples and tests move through the workflow with chain-of-custody recorded at each hand-off.
ReportDashboards update live and client-ready reports generate from the same verified data.
04 Key Features
  • Drilling management Planning, scheduling and tracking from first metre through completion, with stratigraphy documentation and site mapping.
  • Field data capture Purpose-built forms supporting SPT, Shelby, UDS and in-situ testing across multiple device types.
  • Sample & test management Tracking through to completion with chain-of-custody records and automated calculations.
  • Real-time reporting Client-ready geotechnical reports generated automatically from live project data.
  • Analytics dashboards Core recovery rates, trend analysis and performance indicators visible at a glance.
  • Role-based access Differentiated permissions for administrators, field teams and clients.
05 Dashboard & Interface Preview
GeoCorelytics — Project overviewLive
CORE RECOVERY 94.2% BOREHOLES ACTIVE 18 METRES DRILLED 1 284 SAMPLES IN TRANSIT 07 STRATIGRAPHY — BH-114 0m7m15m 22m30m CORE RECOVERY BY RUN (%) TARGET
06 Data Captured & Analysed
Borehole location & depthStratigraphy & lithologyCore recovery & RQD SPT blow countsShelby & UDS samplesIn-situ test results Sample chain of custodyLaboratory resultsRig & crew productivity Timestamps & operator IDSite photographsProgramme progress
07 Business Benefits
Reporting turnaround cut from weeks of manual compilation to generation on demand
Transcription errors removed by capturing once, at source, with validation
Defensible chain of custody and full traceability from field to final report
Underperforming runs and rigs visible during the programme, not after it
Planning and design teams working from verified, current data
Client confidence through transparent, consistent reporting
08 Typical Industry Applications
Mining & Resources — exploration and geotechnical programmes Infrastructure & Construction — site investigation Energy & Utilities — foundation and route studies Geotechnical consultancies Contract drilling companies

SiteSafety

Real-Time HSE Data Analytics System

01 The Operational Challenge

Most operations collect safety and environmental data conscientiously and analyse it far too late. Inspections sit in books, observations are logged in spreadsheets, and the first consolidated view arrives in a monthly report — by which time a developing pattern has had four weeks to become an incident. When a regulator or auditor asks for evidence, assembling it is a project in itself.

02 The Solution We Developed

SiteSafety captures health, safety and environmental data as it is generated and processes it immediately. Operational and compliance teams see current HSE performance rather than a retrospective, critical controls are verified and tracked, and the underlying record is structured from the outset to satisfy audit and regulatory scrutiny.

03 How The System Works
CaptureInspections, observations and readings are logged on device at the point they happen.
VerifyCritical controls are checked against requirement, with exceptions raised immediately.
AnalyseTrends, repeat findings and leading indicators surface as the data arrives.
EvidenceActions are tracked to closure and the audit record assembles itself.
04 Key Features
  • Real-time capture Safety and environmental data recorded across the operation as it is generated.
  • Control verification Critical controls checked, dated and attributed, with gaps escalated automatically.
  • Leading indicators Near-miss and hazard trends surfaced early, rather than after a lost-time injury.
  • Audit-ready records Structured to the governance and regulatory requirements your reporting must satisfy.
05 Dashboard & Interface Preview
SiteSafety — HSE overviewLive
CONTROL COVERAGE 86% VERIFIED TODAY MONITORED CONTROLS Ventilation — Shaft 2 IN RANGE Dust exposure — Plant REVIEW Water discharge — Dam 1 IN RANGE Noise levels — Crusher ACTION SAFETY OBSERVATIONS LOGGED — 30 DAYS D-30D-15TODAY
06 Data Captured & Analysed
Incidents & near missesHazard observationsInspection results Critical control verificationDust, noise & air qualityWater quality & discharge Corrective actions & closureToolbox talks & inductionsPermits to work Contractor complianceLocation, time & reporterPhotographic evidence
07 Business Benefits
Risk patterns visible in days rather than at month-end
Evidence of regulatory compliance available on demand
Corrective actions tracked to closure instead of drifting
Administrative burden on HSE staff meaningfully reduced
Contractor and multi-site performance compared on equal terms
A defensible record if an incident is ever investigated
08 Typical Industry Applications
Mining & Resources — site and contractor HSE Industrial & Manufacturing — plant safety and environment Energy & Utilities — network and generation compliance Infrastructure & Construction — site safety oversight Agriculture — packhouse and farm operations Health — facility and equipment safety
Beyond Our Own Platforms

When No Product Fits, We Build To The Operation

Our own systems address problems we have seen repeatedly. Most client work is different — an existing reporting process that has outgrown its spreadsheets, systems that will not talk to each other, or a decision that nobody can currently evidence.

In those cases we build to the operation: integrating what you already run, and delivering the dashboards and analysis your teams actually need.
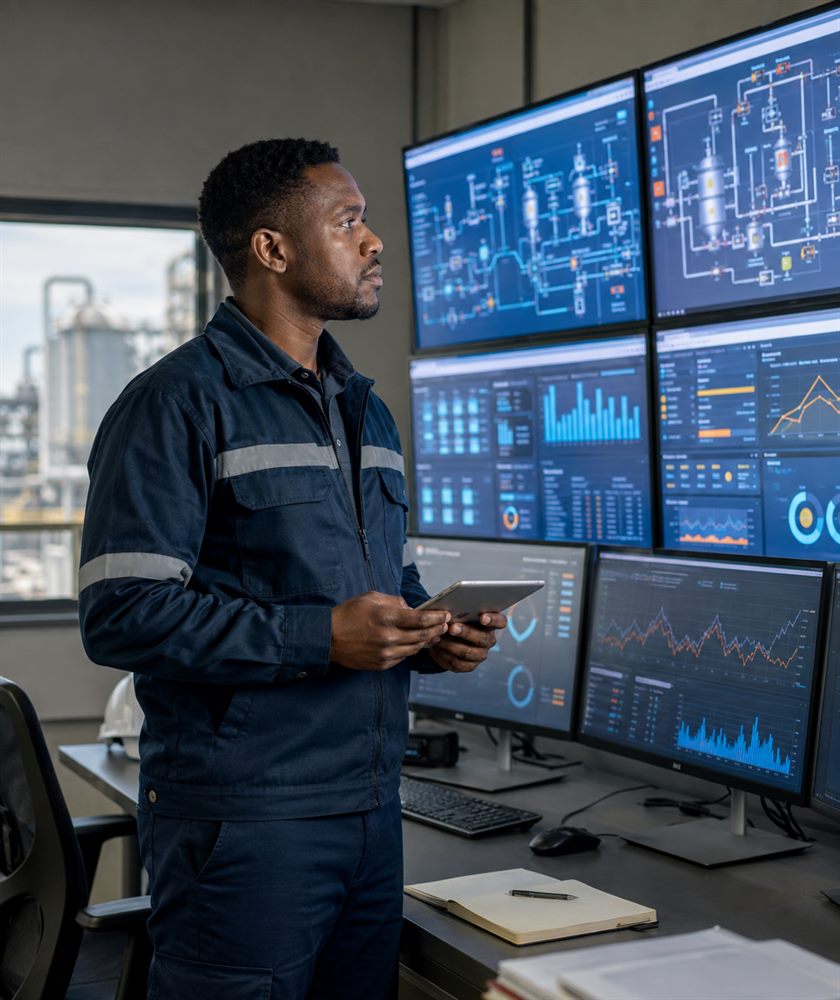
  • Integration with SCADA, IoT, ERP and existing site infrastructure
  • Role-based dashboards from control room to boardroom
  • Field and mobile capture designed for site conditions
See All Our Solutions
Site office with multiple screens showing SCADA and plant performance dashboards
Get In Touch

See A System Working On Your Data

The most useful demonstration uses a sample of your own data. Tell us what you have and we will show you what it could look like.

Request A Demo

  • Demonstrations use a sample of your own data
  • Deployment planned around your operating schedule
  • Any data you share is handled under POPIA and returned or destroyed